Mineral Content During Coffee Extraction, and Effects on Flavor
Spencer King
Marywood University
Chapter I: Introduction
Coffee, the most widely consumed beverage in the world, also contains caffeine, the most widely consumed psychoactive chemical in the world according to McGee, H.(2004). Coffee is thought to have originated in eastern Africa, most likely Yemen, and now grown all around the world. Several methods of brewing, and preparing coffee are available, such as french press, drip, and espresso being the most commonly encountered(McGee, H. 2004). Particular emphasis is placed on controlling variables in all aspects of coffee making in an attempt to create a flavorful drinking experience. Coffee origin, growing conditions, dry vs wet processing, roasting, grinding, water to coffee ratio, water temperature, and brew time all receive considerable attention. Mineral content of the brewing water is an often overlooked variable, which could be easily altered with minerals commonly available at home, to improve flavor, and clarity. Water hardness, or softness, a measure of water mineral content, is known to have in influence in the quality of coffee brewed, on both flavor, clarity, and (McWilliams, M. 2008). The SCA, or Specialty Coffee Association has published standards regarding water used for brewing, with clearly defined ranges for total alkalinity, PH, calcium, and sodium(“Coffee Standards”).
Coffee, according to World Coffee Research organization is a highly complex beverage, with almost infinite flavors, from a multitude of chemical flavonoids, and varies greatly in aroma, texture, and flavor more so then any other food. Coffee would be described by many, as sour, bitter, or acidic(Sensory Lexicon, 2017). Milk, cream, sugar, and other flavorings are often added to curb this bitter or sourness, possibly off setting the documented health benefits of coffee consumption(Poole et al 2017). Would the alteration of the water mineral content prior to brewing have an appreciable effect, negating the addition milk, cream, sugar, or other flavorings?
Statement of the Problem:
The purpose of this experiment is to determine the effects of the mineral content of water used to brew coffee, and its effects on flavor, mouthfeel, and PH of the resulting solution. The effects of no mineral content(distilled water), commercially available bottled water, and a commercially available mineral water additive(3rd wave water) will be compared.
Sub-Problems:
- What effect does increasing the mineral content of water have on fruity flavors in coffee?
- What effect does increasing the mineral content of water have on sweet flavors in coffee?
- What effect does increasing the mineral content of water have on sour flavors in coffee?
- What effect does increasing the mineral content of water have on mouthfeel in coffee?
- What effect does increasing the mineral content of water have on pH in coffee?
- What effect does increasing mineral content of water have on total extraction(as measured via TDS) have on brewed coffee?
- What effect does zero mineral content of water have on fruity flavors in coffee?
- What effect does zero mineral content of water have on sweet flavors in coffee?
- What effect zero mineral content of water have on sour flavors in coffee?
- What effect does zero mineral content of water have on mouthfeel in coffee?
- What effect does zero mineral content content of water have on pH in coffee?
- What effect does zero mineral content of water have on total extraction(as measured via TDS) have on brewed coffee?
Hypothesis:
Added minerals will have a favorable effect on coffee flavor, decreasing sour flavors, increasing sweet, and fruity flavors, and improving mouthfeel over water containing no minerals, and those found in commercially available water.
Null Hypothesis:
Added minerals will have no favorable effect on coffee flavor, decreasing sour flavors, increasing sweet, and fruity flavors, and improving mouthfeel over water containing no minerals, and those found in commercially available water.
Definition of Terms:
- TDS -Total Dissolved Solids, or the sum of all disolved solid substances in water. Estimated via electrical conductivity by assuming a fixed composition(Wellinger, M. et. al. 2018).
- pH -Measure of hydrogen ion(H+) concentration, based on a 1(acidic) – 14(basic/alkaline) scale(McWilliams, M. 2008).
- Distilled water(DW) – Water purified and deminalized through distillation(Wellinger, M. et. al. 2018).
- Reverse osmosis water(RO) – Water that has been purified via reverse osmosis, a process that utilizes semi-porous membrane and hydro static pressure to purify water(Wellinger, M. et. al. 2018).
- Hard water -Water containing high levels of calcium and magnesium ions(Ca2+ and Mg2+)(McGee, H. 2004).
- Soft water – Water containing low levels of calcium and magnesium ions(Ca2+ and Mg2+)(McGee, H. 2004).
- Anion – Negatively charged ion(e.g. Chloride bicarbonate) (Wellinger, M. et. al. 2018)
- Cation – Positively charged ion(e.g. Calcium)(Wellinger, M. et. al. 2018)
- Third Wave Water – Commercially available water mineral additive marked towards home coffee brewers https://thirdwavewater.com/
- Rank Order – A subjective test where all samples are ranked in order of a certain characteristic(McWilliams, M. 2008).
Delimitations of the Study:
This study only looked at the effects waters mineral content(distilled water, bottled water, mineral added water) has on this specific roast(medium), coffee varietal blend(30% Brazil Carmo de Minas Yellow Burbon Natural Process, 70% Colombia Cauca Regional Select Washed Process), brewing method(commercial drip – 30sec pre soak, 202F), grind size, and coffee: water ratio(17:1), and the relationship to only the basic flavor characteristics of coffee. The results cannot be generalized to other brewing methods, or other brewing conditions.
A simple tasting, and scoring method was used in place of a more advanced cupping methodology due to lack of training in subjects, researchers, and time constraints. A sample of convenience was used, and may not accurately represent global coffee drinkers.
Limitations of the Study:
Possible limitations of this study include participant sensitivity to minute changes in coffee flavor, body, and acidity. As well as flavor preferences that may not be shown in coffee selection.
Chapter II: Literature Review
Coffee the most widely consumed beverage in the world, has several reported health benefits shown in observational studies including; a reduction in all cause mortality, reduction in cardiovascular disease, and mortality, and a reduction in cancer, and several metabolic liver diseases(Poole, et al., 2017). Conversely, sugar, a common addition to coffee for many drinkers to cover strong, bitter, sour, or acidic flavors found in coffee, is associated with an increased risk of; weight gain development of metabolic syndrome and type 2 diabetes(Malik, et al., 2010). Variations in brewing methods, water including mineral content may be able to attenuate these bitter, sour and acidic flavors, negating the requirement for the addition of sugar, and having a favorable effect on the health of habitual coffee drinkers.
As discussed in Hendon, et al.(2014), there are many variables that determine the outcome of a cupped coffee, including but not limited to; water temperature, water to coffee ground ratio, coffee grind size, and time of extraction. Hendon, et al.(2014) conclude that the waters composition is what ultimately facilitates the extraction of sugars, starches, bases, and acids of the coffee grounds. Hendon, et al.(2014) looked at the binding of coffee organic volatile compounds with metal ions; Na+, Mg2+, Ca2+, and Bicarbonate/carbonate, all commonly found in drinking water. Five archetypal acids, caffeine and eugenol were used as representative proxy of extraction from coffee grounds. Each compound was associated with a specific taste; Lactic, and malic acids come across as sour flavors, citric acid expresses a sweet flavor, quinic acid, and chlorogenic acid are considered pungent, and unpalatable. Eugenol giving a woody note(Hendon, et al.,2014) Caffeine, while not not affecting flavor significantly is slightly basic, and is of interest to most coffee drinkers. Mg+ and to a lesser extent Ca+ showed the greatest affinity to lactic, malic, citric acids, quinic, and chlorogenic acids, eugenol, and caffeine, increasing extraction(Hendon, et al.,2014). Na+ was almost non-reactive(Hendon, et al.,2014). Chlorogenic acid was shown to react strongly with bicarbonate/carbonate, neutralizing this unpleasant taste(Hendon, et al.,2014).
As shown in Azoulay, A. et al. “Comparison of the Mineral Content of Tap Water and Bottled Waters”(2001) the mineral content of tap and bottled waters, both imported, and domestically bottled, available in north America varies significantly in concentrations of Na+, Ca+, and Mg2+. American bottled waters were generally low in dissolved minerals, while European waters were higher(Azoulay et al. 2001). Additionally they showed the mineral content of tap waters varied within the same locality. This large variation of dissolved mineral content available to the public is an often overlooked, and unaccounted for variable. Access to bottled waters, either purified via reverse osmosis(RO) or distillation(DW), fortified mineral waters, or use of commercial mineral additives marketed towards coffee drinker all are possible tools to control this variable.
Chapter III: Methods
Sample:
This experiment will utilize 10- 20 male and female, non-smoking, coffee drinkers between the ages of 18-75 in a single blinded study design. Testing will be preformed at August Coffee, a local coffee shop during normal weekday business hours, and with regular customers. Participants were asked upon entering the store if they would participate in a food science experiment involving tasting three coffees. Data was discarded if they did not fit the selection criteria.
Instrumentation:
Coffee will be subjectively evaluated utilizing standardized SCA flavor/aroma wheel. Each participant will be asked to rate each sample on a standardized 10 point intensity scale, for A selection of the basic flavors/aromas(Sweet, Fruity, Sour) found in the inner circle of SCA Flavor Wheel, as well as the samples mouthfeel or body. Samples will also be rated in a rank order fashion.
Coffee samples will be objectively evaluated utilizing digital PH tester pre/post brew to determine added mineral contents effect on acid/base balance. Total Dissolved Solids or TDS will be measured before and after coffee brewing, and compared to SCA standards.
Procedure:
All 3 samples will be brewed according to SCA Best Brewing Practices guidelines for drip brewed coffee with a ratio of coffee-to-water of 55 g/L ± 10%, a temperature of 200°F ± 5° (93.0°C ± 3°), and coffee-to-water contact time of 4-6 minutes(Protocols & Best Practices). Coffee will be stored in preheated thermos, labeled A, B, C and ready for serving. Individual paper drinking cup will be used for each sample, with ice water available between samples.
Analysis:
- Water will be sampled, and analyzed pre-brew, testing for pH(1-14), and TDS(ppm) for comparison post-brew, as proxy of coffee extraction, and acidity.
- Samples will be rated in a rank order fashion(1 least favorable-3 most favorable). The mean of these ratings will be reported.
- Samples will be evaluated on a standardized 10 point intensity scale(0 being not detected – 10 being Extremely Intense), for each of the basic flavors/aromas(Sweet, Fruity, Sour) found in the inner circle of SCA Flavor Wheel, as well as the samples mouthfeel or body. The mean of these ratings will be reported.
- A p-value ≤ 0.05 will indicate strong evidence against the null hypothesis
- A p-value > 0.05 will indicate weak evidence against the null hypothesis.
Chapter IV: Results
Sweetness
Coffees, A, B, and C were compared on levels of sweetness on a 10 point scale. 0 being no detectable sweet flavors, 10 being strong, or easily detectable sweet flavors. Sample B, using bottled Deer Park Spring Water resulted in the highest rankings of sweet flavors, with a score of 4.38/10. Sample A, using DW resulted in the second highest score(4.30/10), and sample C, 3rd wave water the lowest at 3.83/10. A p-value of 0.89 indicates this finding was not significant.
Fruitiness
Coffees, A, B, and C were compared on levels of fruitiness on a 10 point scale. 0 being no detectable fruit flavors, 10 being strong, or easily detectable fruit flavors. Distilled water(DW) used for brewing resulted in the highest score in fruitiness of 4.38/10. Using 3rd wave water for brewing resulted in the lowest scores for flavors best described as purity with a score of 3.91/10. Bottled water was between these two samples with a score of 4.07/10. A p-value of 0.93 showed this effect was not significant.
Sourness
Coffees, A, B, and C were compared on levels of sourness on a 10 point scale. 0 being no detectable sour flavors, 10 being strong, or easily detectable sour flavors. Sample B using Deer Park Spring Water resulted in the lowest score of flavors described as sour with a score of 2.84/10. Samples A, and C were scored similarly with scores of 4.69/10 and 4.41/10 respectively. A p-value of 0.40 was calculated for data on sour flavors detected.
Mouthfeel
Coffees, A, B, and C were compared on levels of mouthfeel or body on a 10 point scale. 0 being light mouthfeel, or body 10 being heavy mouthfeel or body. The mouthfeel of sample A, using distilled water(DW) was rated lowest in terms of mouthfeel. Sample A received an average rating of 4.30/10. Both samples B, and C received ratings with an average of 5/10. A p-value of 0.80 was calculated, and the
Overall Preference
Coffee samples were subjected to a rank order test, and were placed in order of preference by evaluators. The most prefered was between samples B, and C, coffees made with bottled water had 3rd wave water with each receiving 5 votes each. Sample A using distilled water received the least amount votes. Sample B was the second most preferred with 7 votes. Sample C, received again 5 votes, and sample A only 1. Sample A was the least preferred receiving 9 votes for preference 3. Sample B received 1 vote for preference 3, and sample C received 3.
There was no strong trend for the most preferred of the three with both samples B, and C receiving similar scores. When looking at combined scores for preference 1, and 2, sample B received the majority of votes. Subjects were more likely to rate sample C as their least favorite over sample B.
Total Dissolved Solids
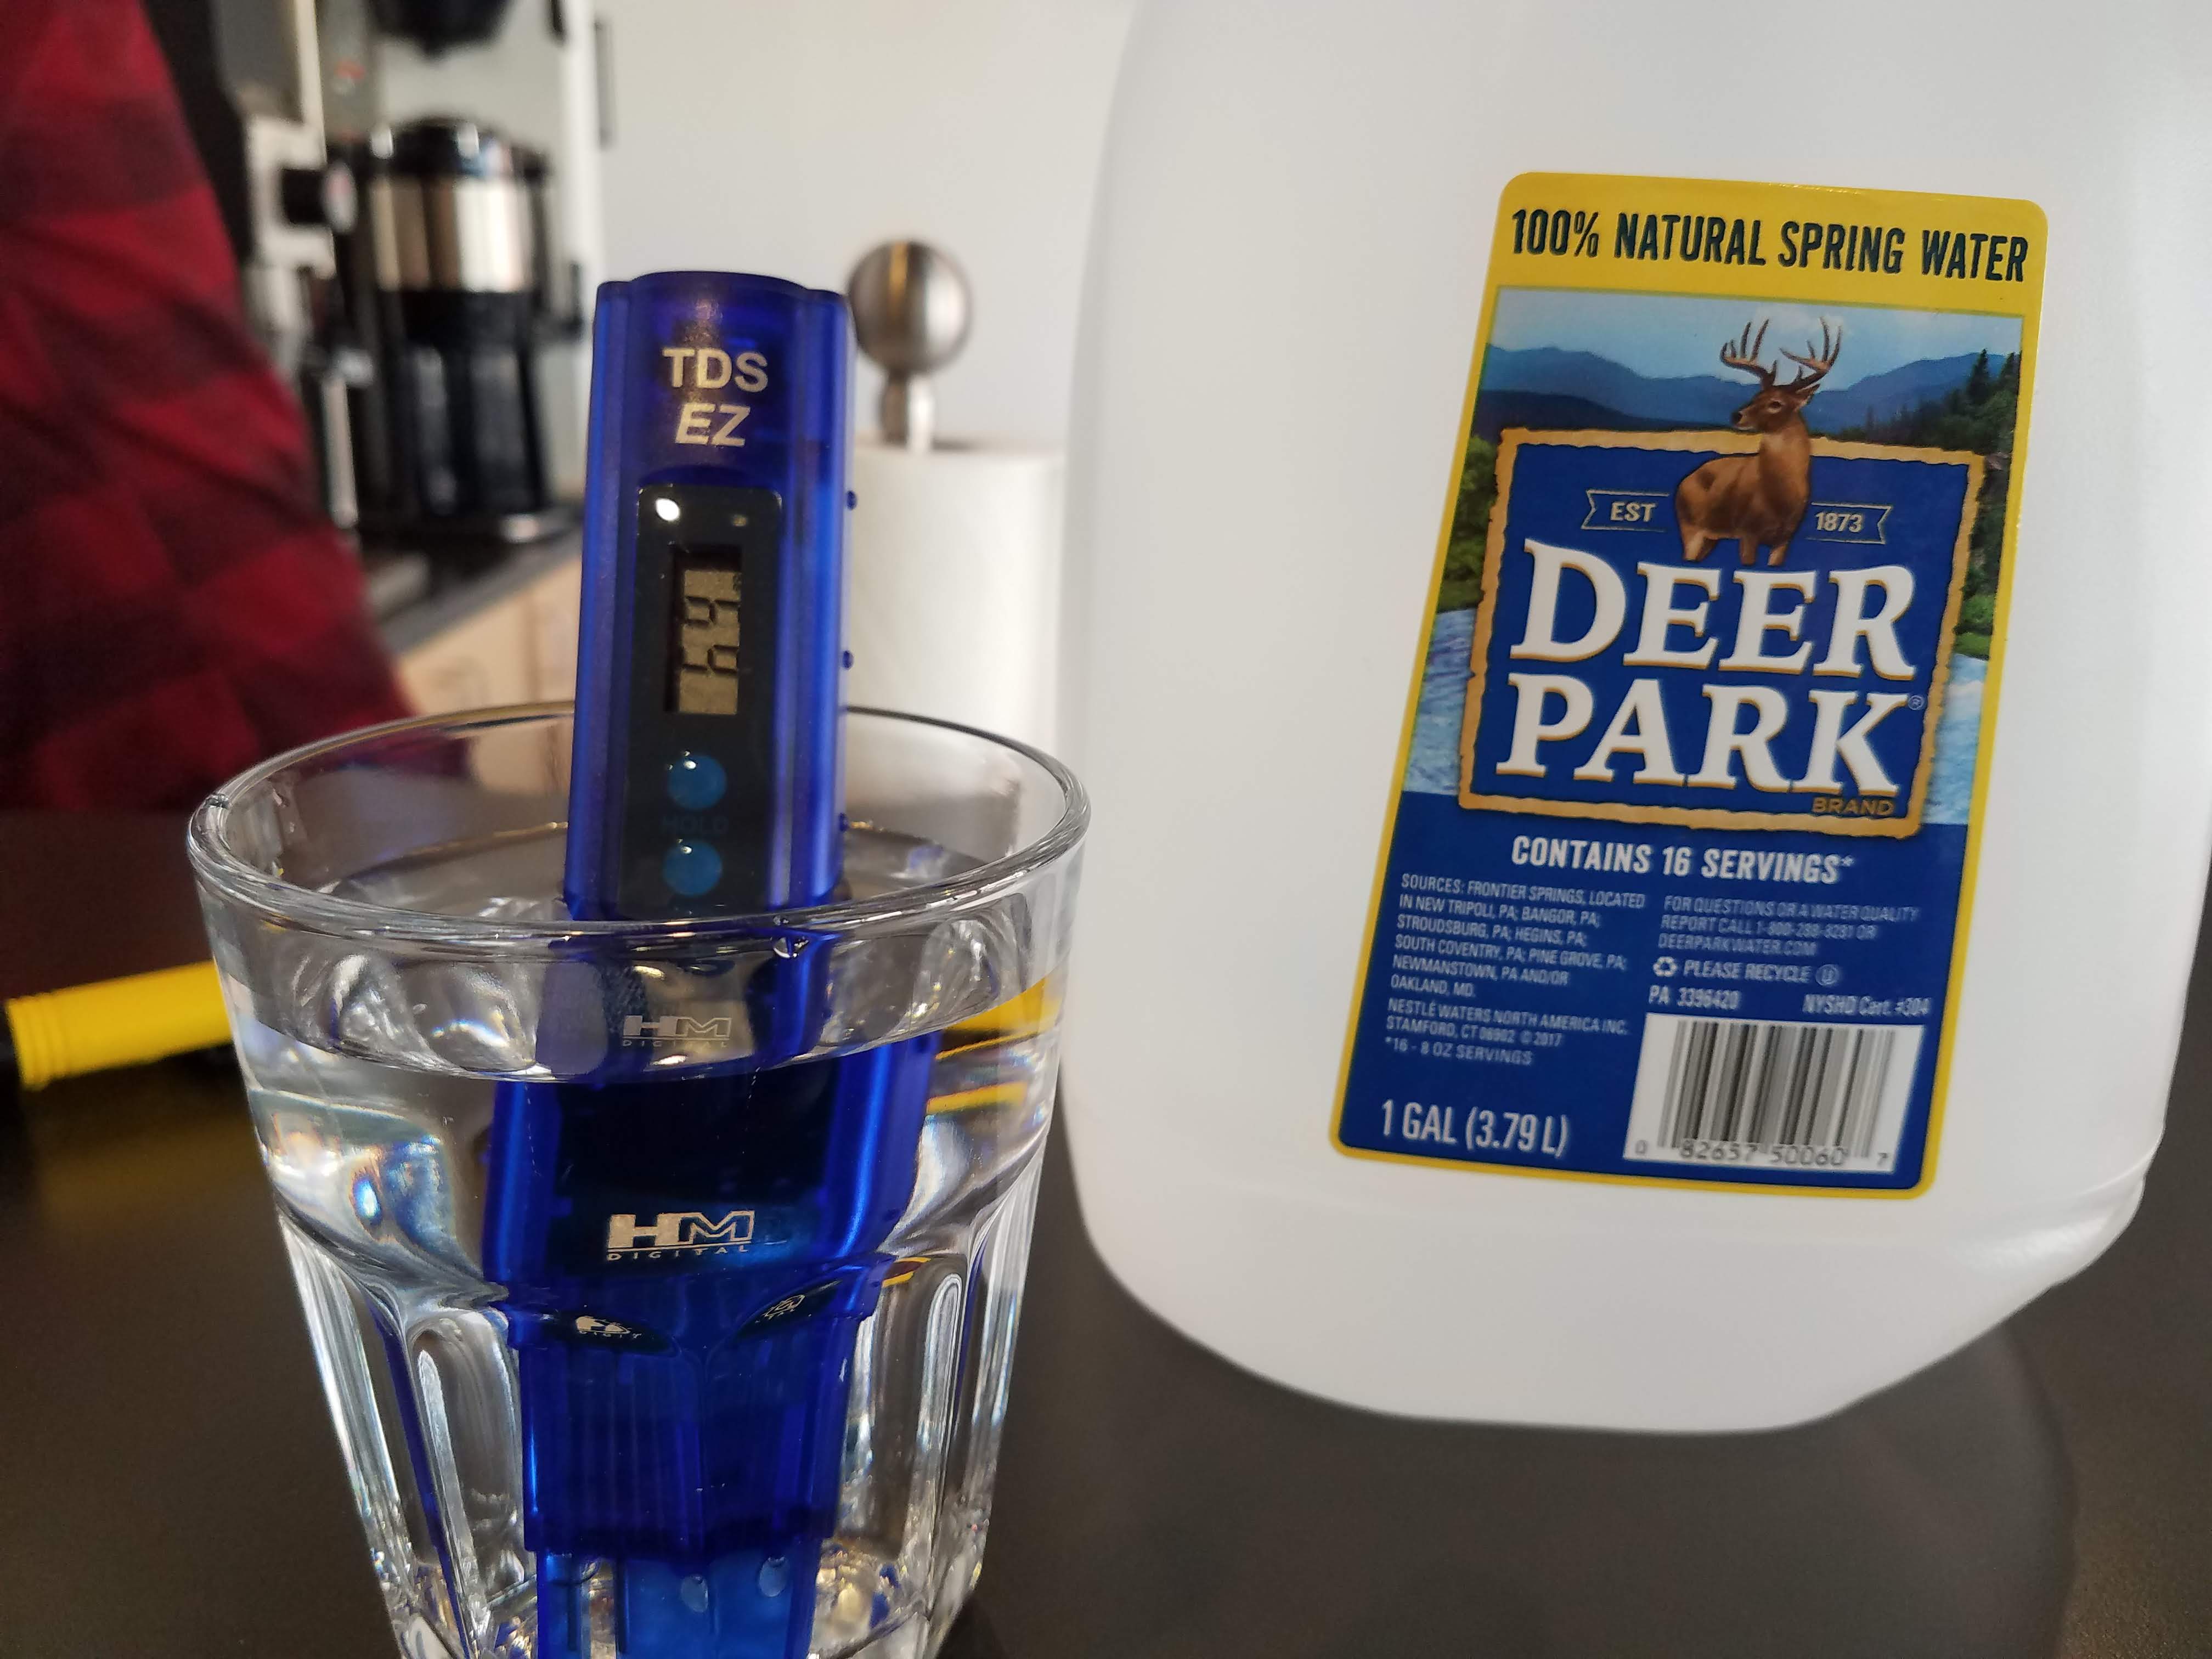
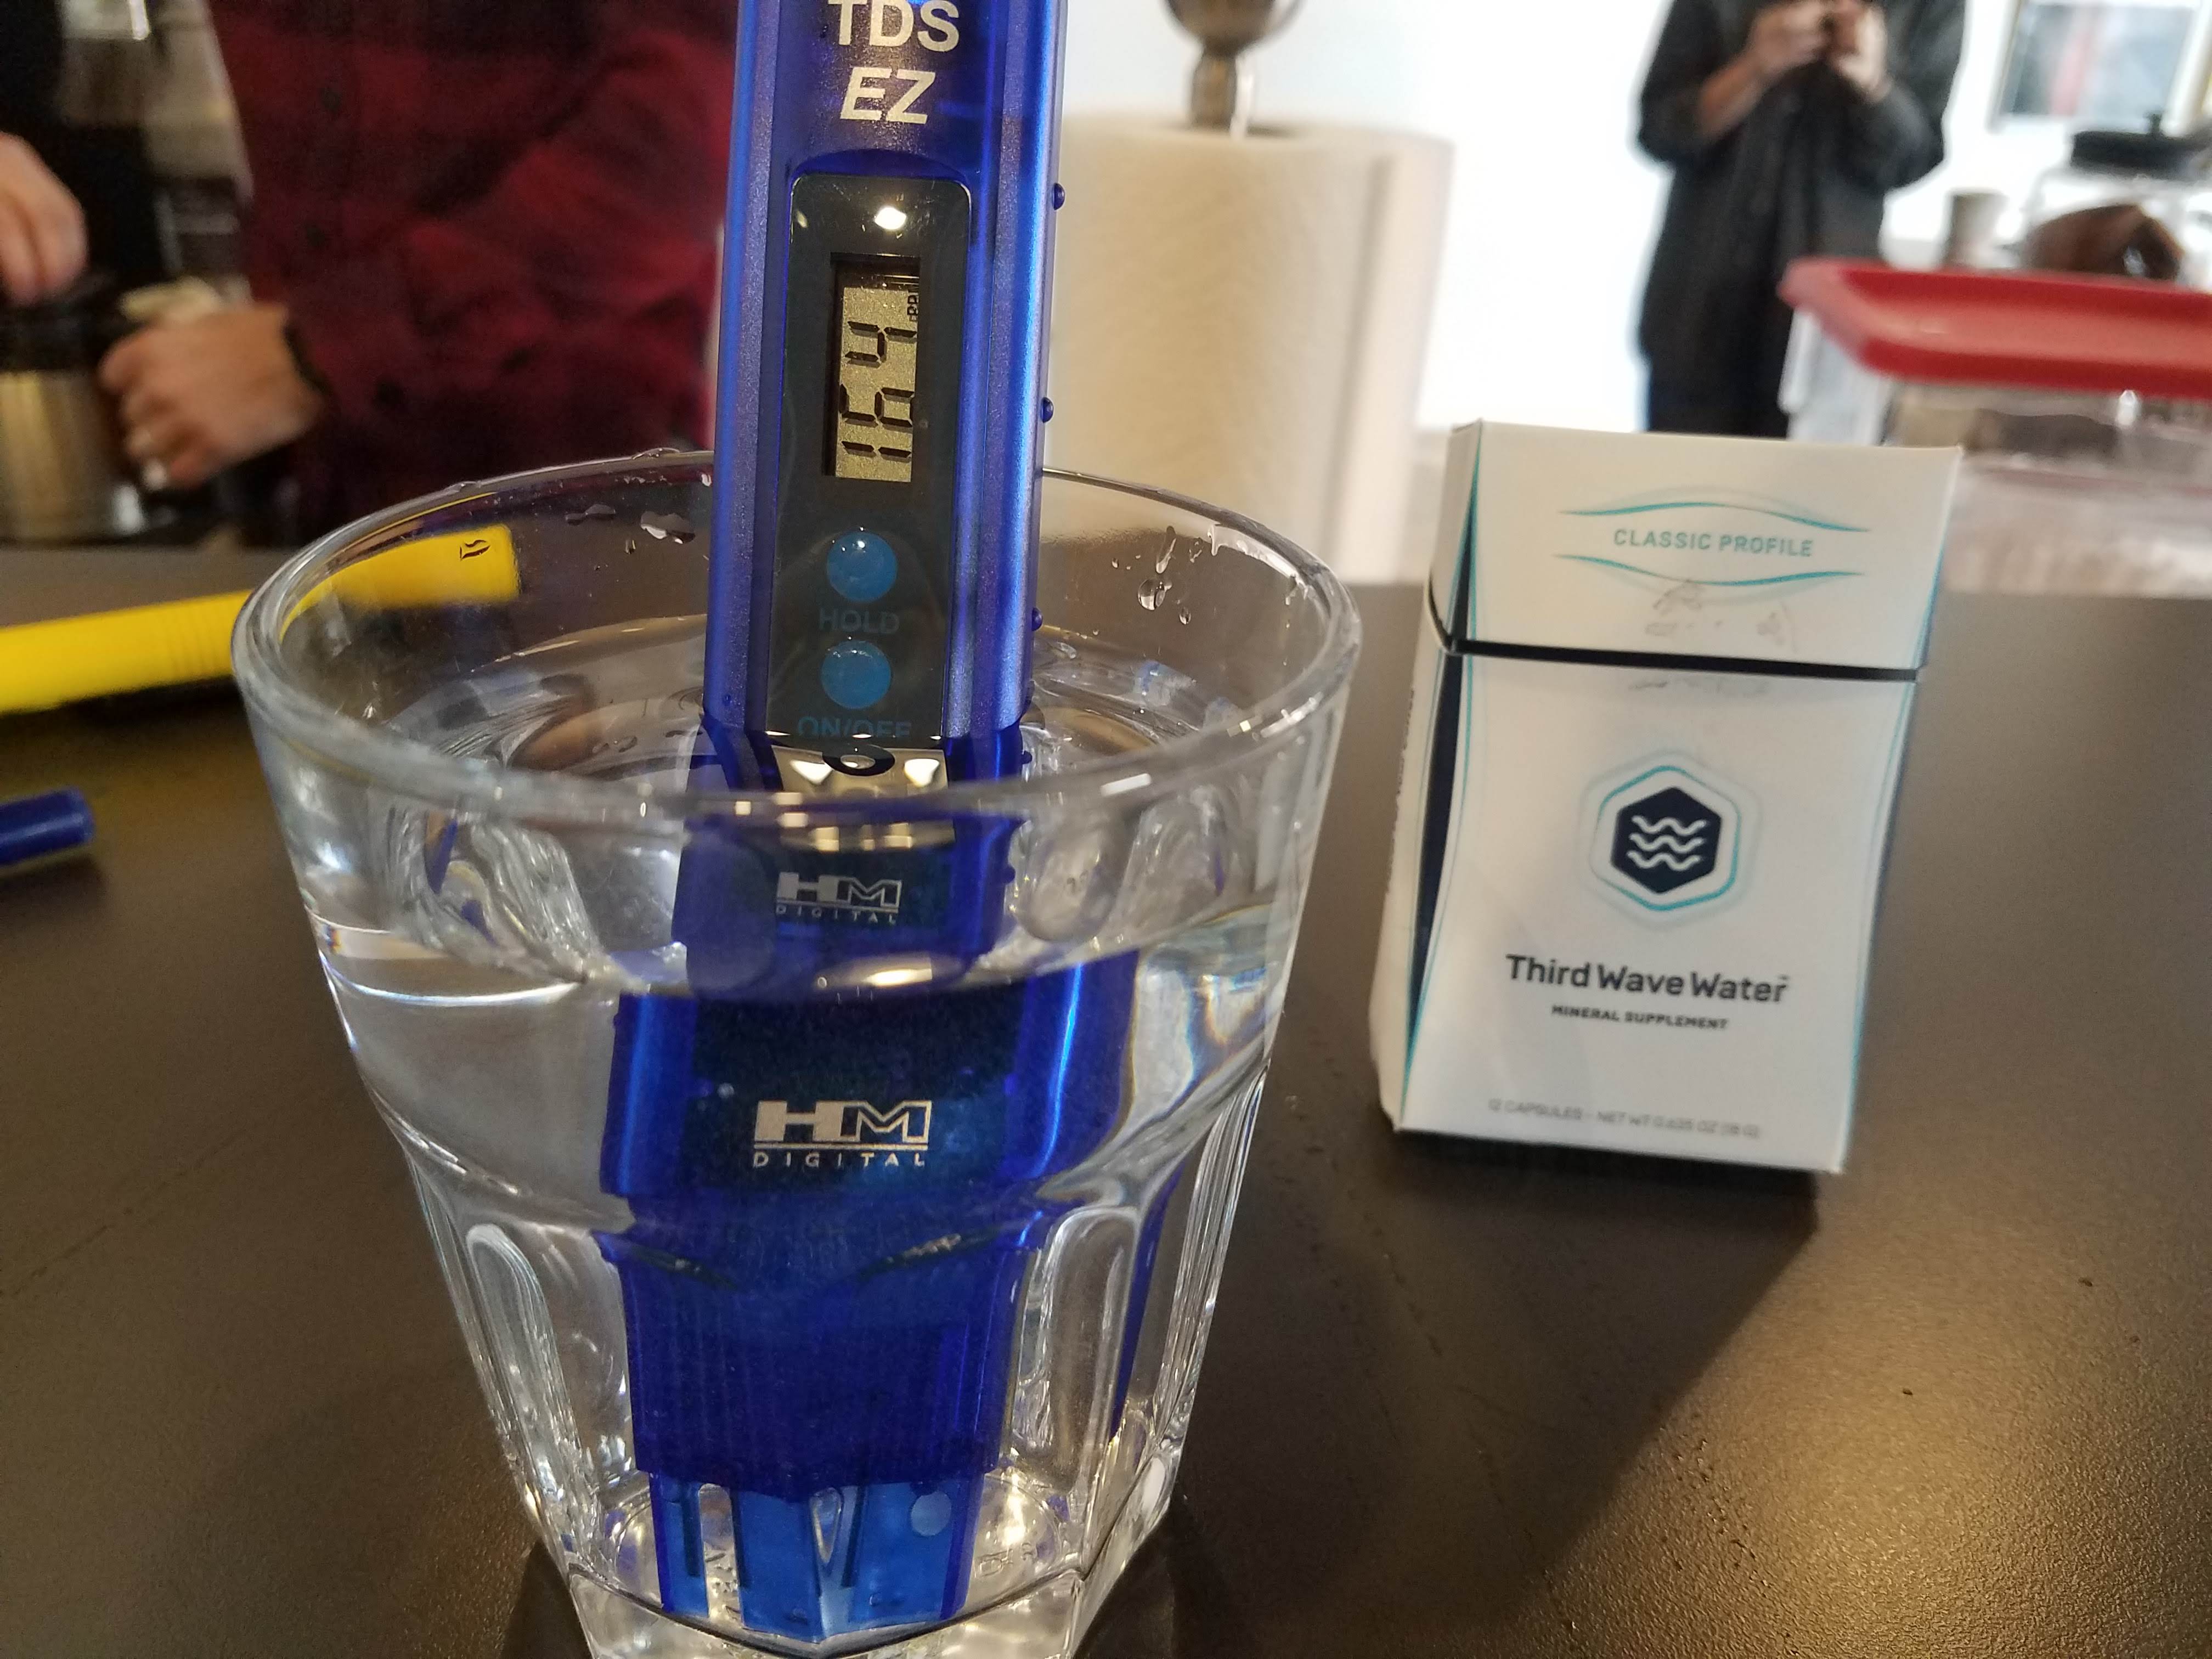
Total levels of dissolved solids(TDS) were tested in coffee samples pre-brew, as well as post-brew. Lower TDS measurements indicate lower dissolved solids, while higher numbers indicate higher amounts of dissolved solids. The make up of the dissolved solids cannot be estimated with a TDS meter, only the approximate content based on assumed ratios. Sample A using distilled water(DW) in pre-brew testing showed 0ppm dissolved solids as expected. In post-brew testing a reading of 161ppm was taken. In sample B, Deer Park Spring Water, A pre-brew reading of 70ppm was taken, and a post-brew reading of 256ppm was taken. Sample C, using 3rd water mineral additive had a TDS of 164ppm pre-brew and a post brew TDS of 276ppm.
PH
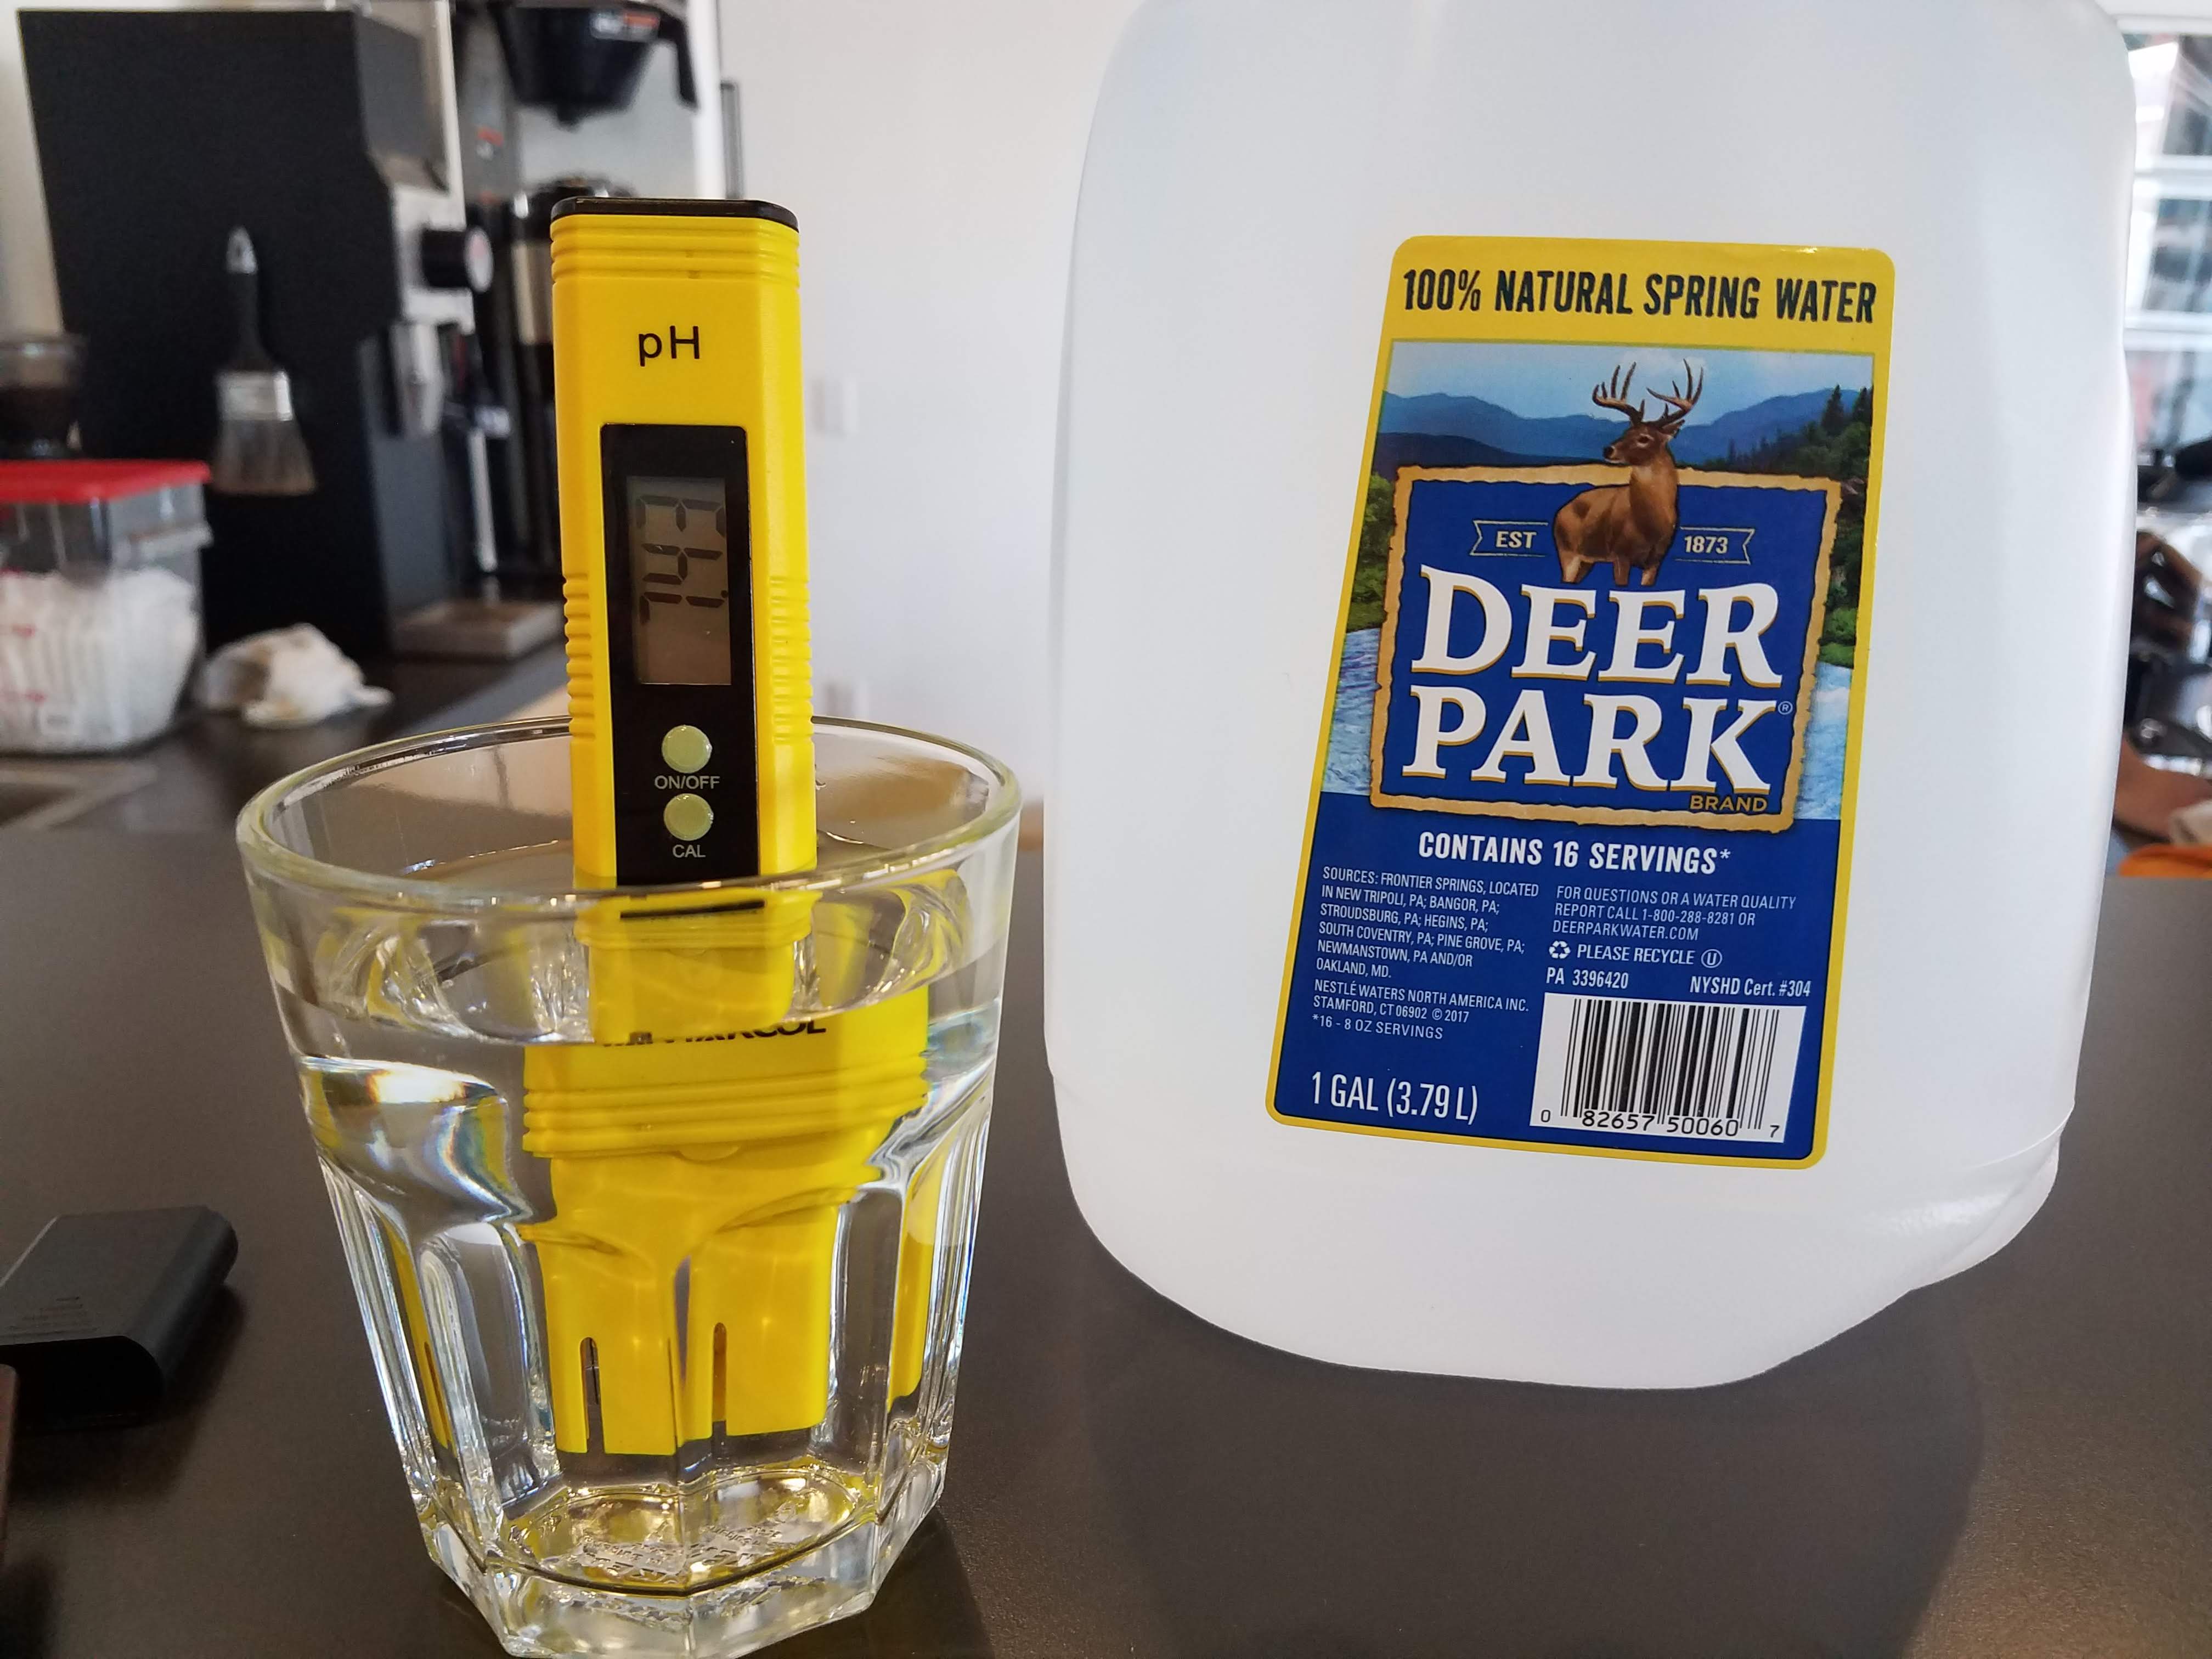
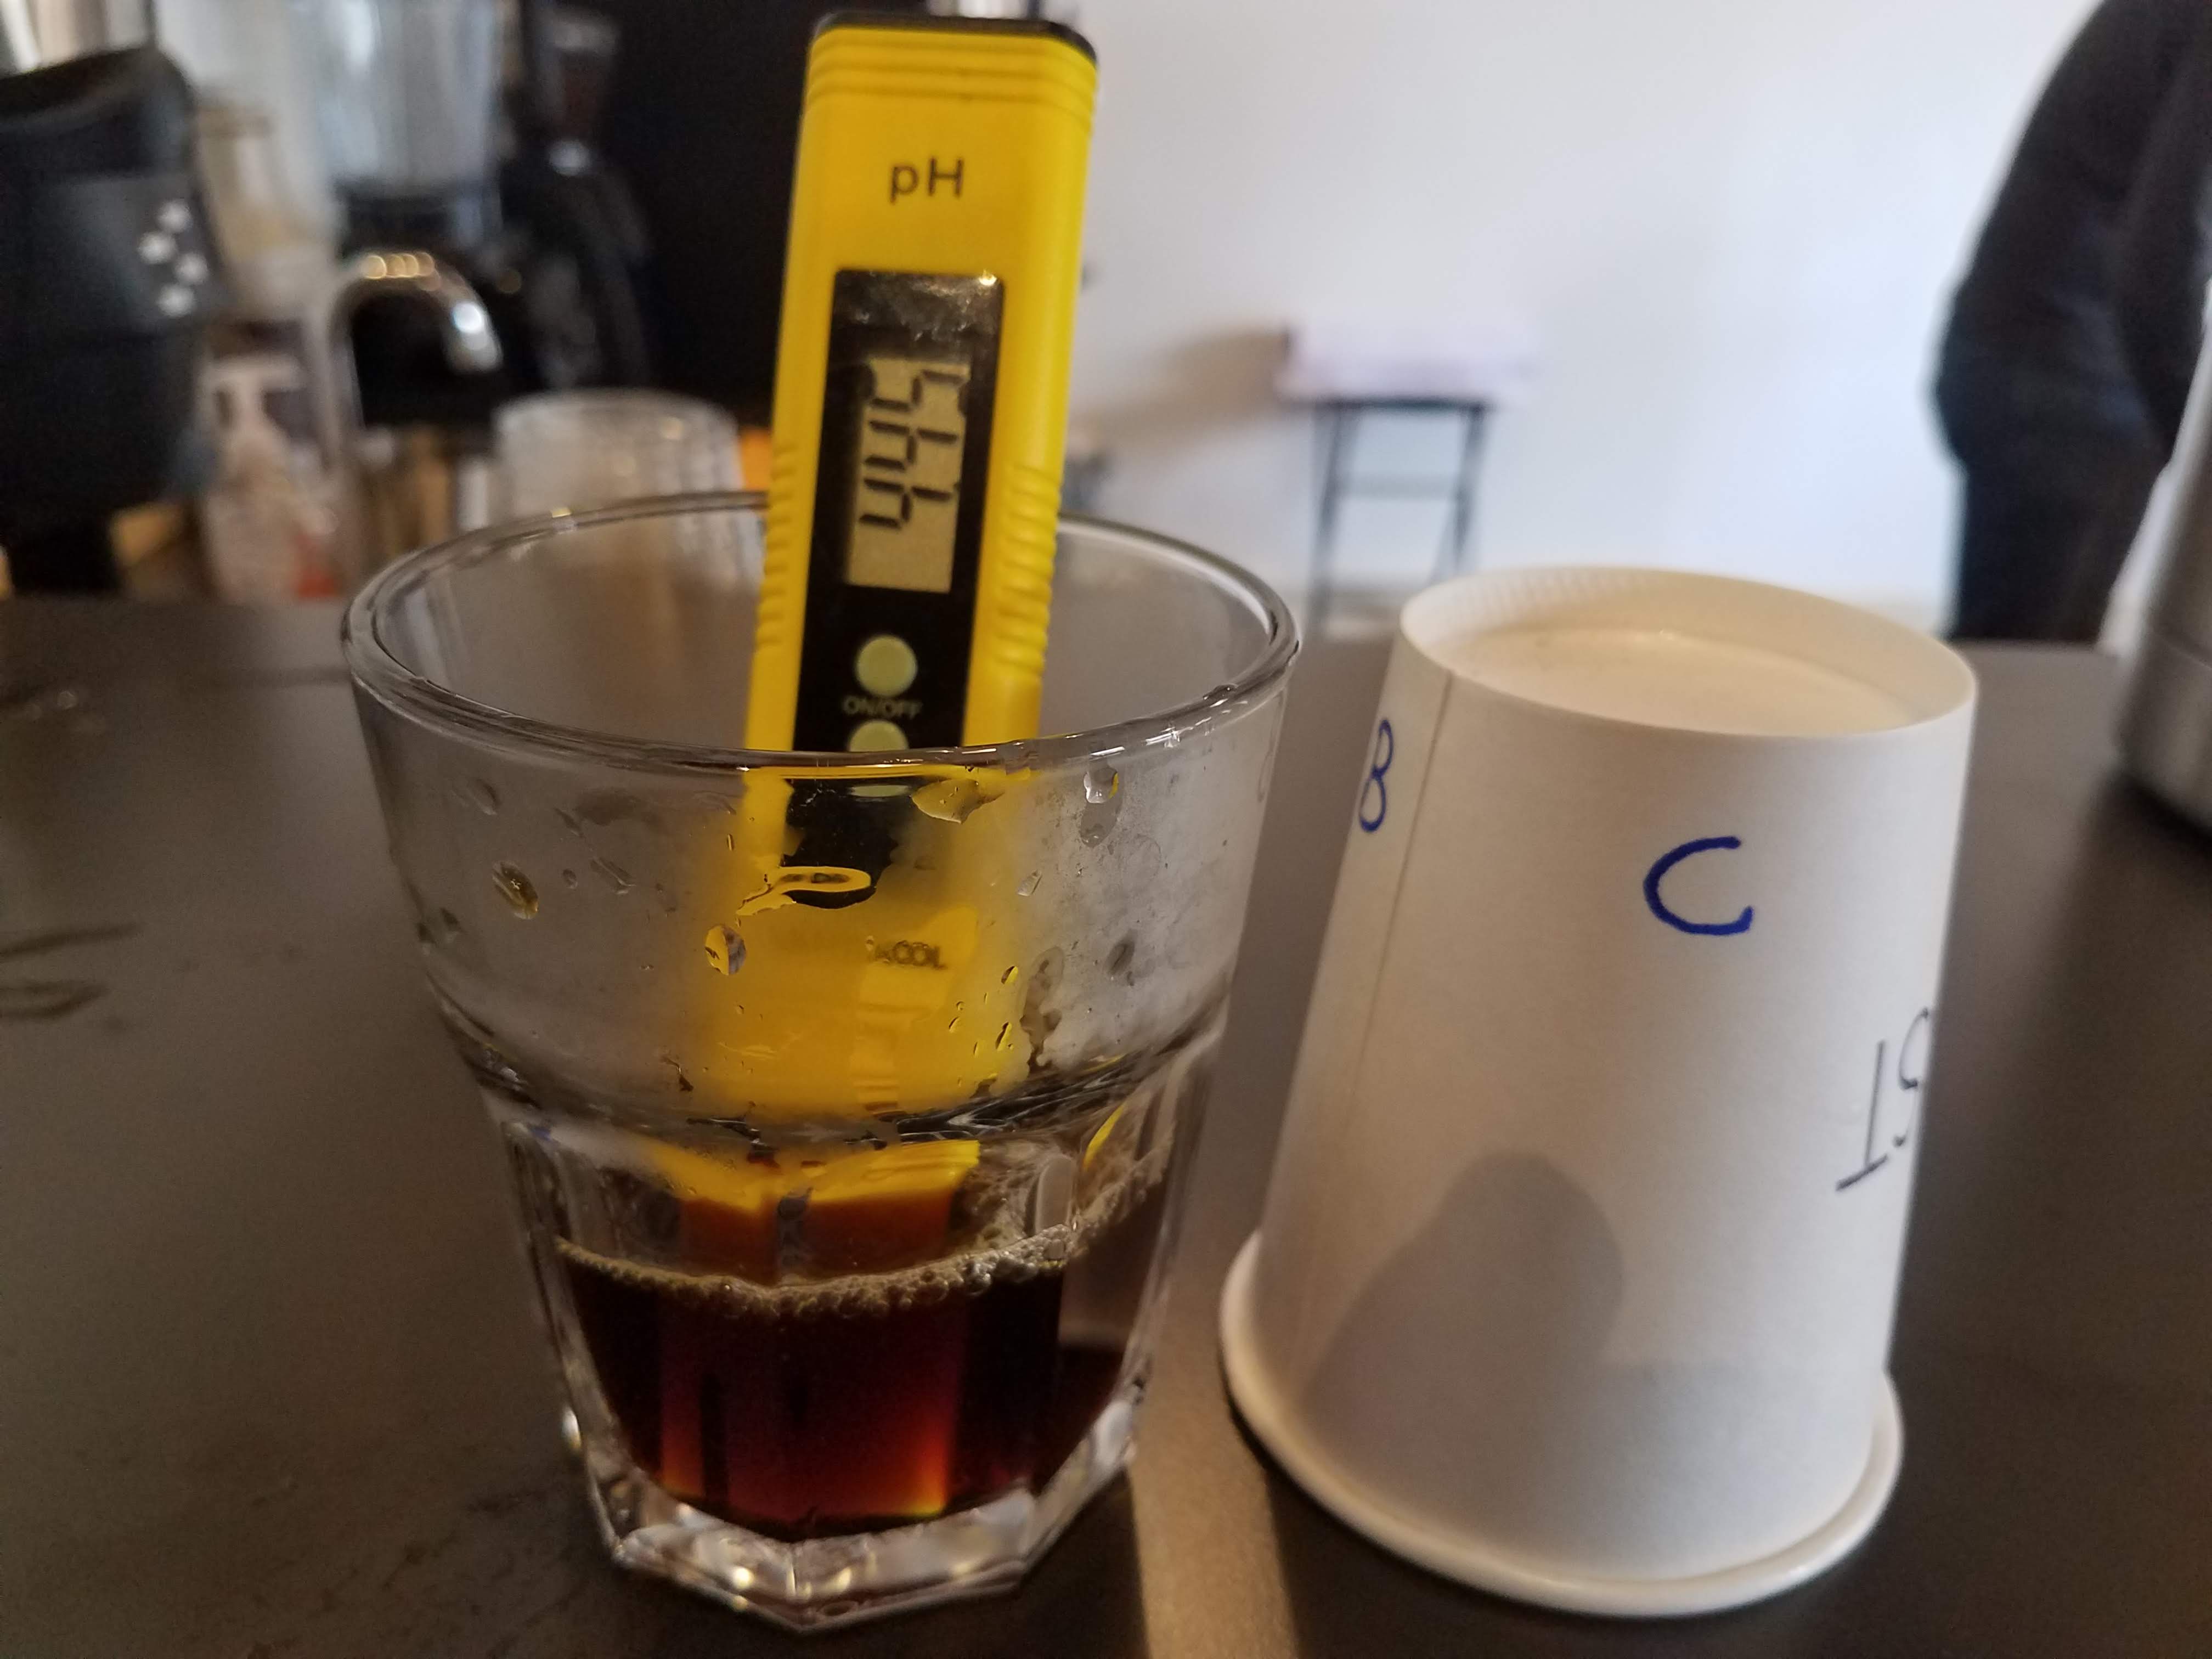
pH of brewing water was tested pre- and post brew. Sample A, using distilled water was the most acidic both pre/post brewing with a pH of 7.86/4.71 pre/post. Sample C, 3rd wave water was the most acidic bot pre- and post brew with a pH of 7.29/4.46 pre/post. These ranges are within the SCA guidelines.
Chapter V: Discussion & Conclusion
Altering the mineral content of brewing water did result in 3 distinct coffee experiences, while utilizing identical brewing practices. All coffees served in this experiment were acceptable, and generally of high quality. Mineral content did have an effect on flavor, and mouthfeel of the coffee served.
Samples A, B, and C all differed only in their mineral content. Sample A using distilled water(DW) which contains zero minerals, during brewing showed a stark contrast to the sample B, and C. Samples B, and C not only differed in their total mineral content, but also the constituents of their mineral content. Unfortunately the exact mineral content of sample B provided by Deer Park is unknown, as its content is listed in acceptable ranges, and not specifics. Its not known how much of an uncontrolled effect this caused in this experiment. The main mineral content differences between samples B, and C were chloride(CL-), citrate, magnesium(Mg+), and sulfate. Sample B contained no citrate, in contrast to the 60mg/l of citrate found in sample C. Sample C contained approximately three times the amount of magnesium, and 119mg/l of sulfate, over two times the amount found in sample B. Total alkalinity, and total hardness was not available for sample C. Additionally, sample B contained several minerals not found in sample C. these included; nitrate, bromide, and potassium. This data is summarized in Appendix E, and was compiled from Deer Park Water Analysis(2017), and Keno(2016).
Subjective data was collected on participants through questionnaire/ score sheet depicted in appendix A, alongside flavor wheel depicted in appendix B. Participants were asked to rates all samples regarding sweet, sour, and fruity flavors, as well as mouthfeel. Additionally samples were ranked in order of preference.
Regarding the presence of flavors described as “sweet” sample B was ranked the highest, and sample C the lowest. Sample A was rated lower, but similarly to sample B. Due to the higher sodium, and chloride levels found in sample C it was expected to have more pronounced sweetness than other samples. Salt has the ability to increase the perception of flavors, specifically sweet flavors that are at or near the threshold level, or the level at which they are detectable(McWilliams, M. 2008). These results agree with the results Wellinger & Yeretzian(2015) published showing waters low in total hardness resulted in coffees with a sweeter taste. This indicates that the use of 3rd wave water, according to data collected in this experiment is not appropriate for individuals who wish to increase flavors described as sweet in their coffee.
Sour flavors generally indicate the presence of hydrogen ions(H+), or OH- when dealing with organic acids(McWilliams, M. 2008). The lower pH, or higher acidity of sample C compared to samples A, and B post brew may have contributed to the increased sourness reported by subjects during our tasting, although this does not explain the increased sourness of sample A which was slightly less acidic than the other samples. The increase in sourness may be explained by the high binding ability of Mg+ to the acids lactic, and malic, described as sour by Hendon(2014), as well as the unpleasing quinic, an chloergenic acids. The collected here does not support the use of 3rd wave water for individuals looking to decrease the precieved sourness of their coffee.
Fruity
Sample C resulted in a lower perception of fruity flavors than both other samples, while sample A resulted in the highest. Although Wellinger & Yeretzian(2015) did not specifically look at fruit flavors in their selected coffees, coffees with softer water, or lower hardness were regarded as having a sweeter taste, and an overall better flavor. This could explain the lack of fruity flavors detected in sample C. Alternatively the lack of Mg+ in distilled water may have caused an extraction of less compounds overall, and as a result the fruity flavors that were extracted were more apparent in sample A, and more muted in sample C. Additionally the high binding ability to mg+ to Quinic acid and its larger derivative chlorogenic acid, which are considered undesirable flavor contributors(Hendon 2014) may have covered any fruity flavors present in sample C. The use of the mineral additive 3rd wave water was not supported in this data, for individuals looking to enhance the fruity flavors in their coffee.
Mouthfeel
Both samples B, and C showed enhanced mouthfeel in comparison to sample A. The low mouthfeel ratings of sample A was expected, due to low amounts of dissolved solids to contribute to heavier body. It was expected that the addition of 3rd wave water minerals would have resulted in an increased body, as sample C had over two times the amount of dissolved solids when TDS was measured.
When asked to rate coffee samples overall, there was no clear winner with comparable scores between samples B, and C. However there was a clear trend, with sample A receiving unfavorable ratings in the rank order test. This result highlights the findings of Hendon, et. al. (2014) that mineral content is a requirement for the extraction of many of the flavor compounds found in coffee beans.
The addition of 3rd wave water minerals did have an obvious effect on the measured TDS in our samples pre-brewing. Although starting with over two times the amount of dissolved solids as the Deer Park spring water, the post-brew water samples of B, and C resulted in similar TDS numbers. Sample A using distilled water, started with 0ppm of dissolved solids and as expected resulted in lower dissolved solids in the post brew testing. The SCA recommends a TDS of 75-250ppm, with an ideal of 150ppm(Wellinger, M., Smrke, S., & Yeretzian, C. 2018), only sample C fell within this range. Although sample C fell within the ideal TDS range of the SCA, an overly sour flavor was reported. According to the Religh Coffee Company, coffees brewed with water containing high levels of TDS tend to under extract the coffee, due to the already high levels of dissolved solids, and preventing further saturation(Bland, J. 2015). This often leads to brewed coffee, with overly sour flavors or a lack of sweetness(Bland, J. 2015). This research corresponds with the findings of this experiment. The use of mineral additives is not indicated for individuals looking to increase the sweetness, decrease the sourness or fruitiness of their coffee.
Conclusion:
Brewing coffee is a highly complex task, with a multitude of steps, from harvest to the final brewed product. These variables bust be controlled at every step to ensure a high quality, delicious beverage. The hypothesis that added minerals will have a favorable effect on coffee flavor, decreasing sour flavors, increasing sweet, and fruity flavors, and improving mouthfeel over water containing no minerals, and those found in commercially available water, was not supported by the data collected in this experiment. Although samples B, and C were both rated well overall in comparison to sample A containing zero minerals, the use of brewing water prepared with 3rd wave water minerals is not recommended. This recommendation is made with the assumption that local waters will be of similar mineral content as the spring water used in this experiment.
Works Cited
McGee, Harold (2004). On Food and Cooking: The Science and Lore of the Kitchen. New York, NY: Scribner- Azoulay, A., Garzon, P., & Eisenberg, M. J. (2001). Comparison of the Mineral Content of Tap Water and Bottled Waters. Journal of General Internal Medicine, 16(3), 168–175. http://doi.org/10.1111/j.1525-1497.2001.04189.x
- Coffee Standards. (n.d.). Retrieved October 2, 2018, from https://sca.coffee/research/coffee-standards/
- Protocols & Best Practices. (n.d.). Retrieved from https://sca.coffee/research/protocols-best-practices/
- E. C., Dr. (2017). Sensory Lexicon[PDF]. College Station, TX 77843-2477: World Coffee Research. https://worldcoffeeresearch.org/media/documents/20170622_WCR_Sensory_Lexicon_2-0.pdf
- Hendon, C. H., Colonna-Dashwood, L., & Colonna-Dashwood, M. (2014). The Role of Dissolved Cations in Coffee Extraction. Journal of Agricultural and Food Chemistry,62(21), 4947-4950. doi:10.1021/jf501687c https://pubs.acs.org/doi/pdfplus/10.1021/jf501687c
McWilliams, M. (2008). Foods: Experimental Perspectives. Upper Saddle River NJ: Pearson Prentice Hall- Poole Robin, Kennedy Oliver J, Roderick Paul, Fallowfield Jonathan A, Hayes Peter C, Parkes Julieet al. Coffee consumption and health: umbrella review of meta-analyses of multiple health outcomes BMJ 2017; 359 :j5024 https://www.bmj.com/content/359/bmj.j5024
- Malik, V. S., Popkin, B. M., Bray, G. A., Despres, J., Willett, W. C., & Hu, F. B. (2010). Sugar-Sweetened Beverages and Risk of Metabolic Syndrome and Type 2 Diabetes: A meta-analysis. Diabetes Care,33(11), 2477-2483. doi:10.2337/dc10-1079
- Wellinger, M., Smrke, S., & Yeretzian, C. (2018). The SCA water quality handbook: Part One: A systematic guide to water fundamentals. Santa Ana: Specialty Coffee Association.
- Deer Park 2017 Water Analysis Report. (2017). Retrieved December 01, 2018, from http://www.nestle-watersna.com/asset-library/Documents/DP_ENG.pdf
- Keno(2016, Dec, 31 9:04pm) Third Wave Water [Online fourm comment]. Message posted to https://www.home-barista.com/water/third-wave-water-t44736-10.html
- WELLINGER, M., Dr., & YERETZIAN, C., PROF. (2015). Water: Why Quality Matters. CafeEuropa, Autum(2015), 20-22.http://scae.com/images/caffee-europa/CE61.pdf
- Bland, J. (2015, July 28). TDS and Coffee. Retrieved from https://www.raleighcoffeecompany.com/tds-and-coffee/
Appendix A: Score Sheet

Appendix B: Flavor Wheel

Appendix C: pH Readings


Appendix D: Total Dissolved Solids(TDS) Readings


Appendix E: Water Mineral Content
Sourced from: Deer Park(2017), and Keno(2016).
Appendix D: Testing Location Photos

August Coffee/ Veloce Bikeworks
Appendix E: Raw Data